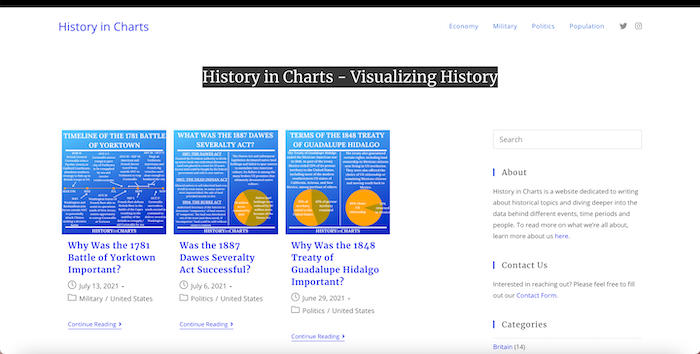
History in Charts is a website dedicated to sharing historical periods, events and people, and the data behind them. For visual learners history can be difficult to relate to. Inserting historical data into a chart format allows us to see history in a different light. Not only are there pictures and paintings to give us insights, but also data and records that can tell us many more details surrounding the events and people. History can be exciting, puzzling, mysterious, and captivating, sometimes all at once. This is what brings people back, again and again. Our ability to learn from our collective history enables us to move forward to create a better future.

Welcome to The History Creatives Hub. This is the place to showcase the amazingly eclectic and talented people within the history loving community. I’m sure you’ll find, as I have, some wonderful blogs, podcasts, channels, products, authors and more to connect with.
And, if you’re reading this and run a history inspired venture then what are you waiting for…
- Home »
- Explore History Blogs »
- History in Charts


History Blogging: 35 ideas for blog posts
Whether you’re a beginner or have been history blogging forever coming up with ideas for blog posts is a constant issue. Do any of these sound like you?
You have stacks of ideas (but no time)? You get overwhelmed researching a topic you love and struggle to create the actual blog post, which then drifts? You’re bouncing week to week writing blog post ideas that are just well okay? or perhaps you’re losing faith and need to add some variety and sparkle to your editorial calendar.
-
 7 tips to sell history products in your emails without feeling awful.April 4, 2023/0 Comments
 -

-
 6 Types of History Blog Posts Which Always Seem to Get NoticedJanuary 19, 2023/
 -
 How to Take Notes Like a Pro for Your History Blog PostsNovember 1, 2022/
 -
 Should I Start a History Blog?October 3, 2022/


