
You’ve probably heard this advice. “Build your history blog’s content around what your analytics tell you is doing well”. But, analytics can be a bit scary especially if like many history bloggers you’re more of a words person and well data and stats are just not your thing. So, here is some help understanding what Google analytics is and what it could mean to you as a history blogger.
And why am I focussing on helping you understand Google Analytics? Because, by far, the best way to analyse the views your blog or website is getting is by using Google Analytics. Plus, it’s the standard tool most websites use to track their user engagement.
What is analytics?
Analytics is a collection of data or information which you can use to look for useful patterns and crucially to make decisions about what you do next on your history blog.
Some of the information collected includes
- how many total visitors your blog has had
- where in the world those visitors are located
- what device they use to view your blog
- how they navigate through your blog, and
- how long they spend on each page.
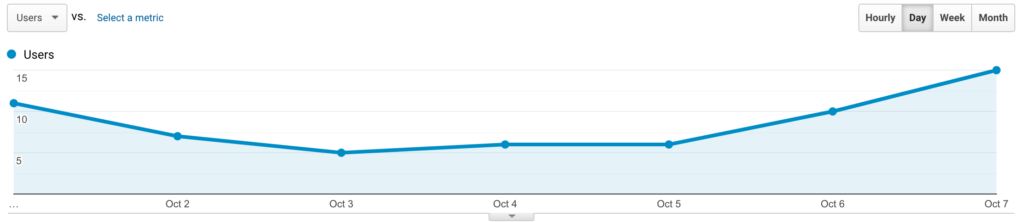
This information can be broken down by hour, day, week or month or customised by you.
Understanding Google Analytics terms
Below, I cover the basic terms you’ll need to know to get a better understanding of how your visitors are engaging with your blog. Plus, I include some quick and easy improvements you can make to help improve the experience your visitors have when they discover your fabulous history blog.
Users & New Users:
Users are essentially the visitors/readers who have found your blog. Either through referral links, social media links and directly or organically.
When the users enter your site they are being tracked. So the pages they visit, how long they stay on them, what they click on etc is all registered and broken down into charts and graphs for you to assess on Google Analytics.
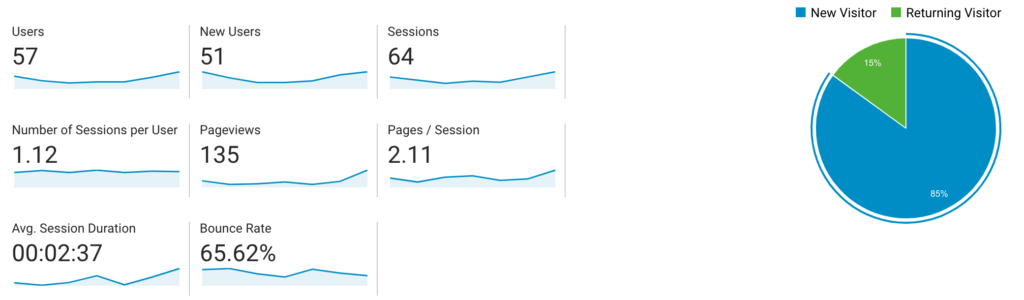
Google can also tell you if the person is a returning user or a new user through the use of tracking cookies.
Sessions:
A session is the amount of time a user is actively engaged on your website. So someone may be clicking to new pages, products, adverts or posting a comment.
After 30 minutes of inactivity, the session will time out. For example, if they leave the tab open and leave to do something else.
If they then come back after 30 minutes the analytics starts to track a new session for them. If they come back at say 28 minutes Google tracks it as part of the original session. And if they were to close the site and then come back Google will track this as a new session.
Pageviews:
Pretty self-explanatory. It’s the pages your user has viewed. If they were to reload the page, or leave that page and come back it would be counted as an individual page view.
Pages/Session:
The average number of page views from a user in a single session. This is important as it shows whether users are sticking around and why you should always have simple navigation and include internal links in every page i.e “If you loved my post on Millicent Fawcett click here for my profile of fellow Suffragette Emmeline Pankhurst.”
Avg. Session Duration:
This is the time, on average, spent on your site during any visit. (Total time on site ÷ Total visits = Average time on site)
Bounce Rate:
A bounce rate is a user session that triggers only a single request, such as opening a single page on your site and then exiting without doing anything else. There are a number of reasons a user may only engage once then leave.
- It could be that they were put off by excessive pop-ups.
- Poor user experience ie they couldn’t quickly find the information they wanted.
- They couldn’t navigate the website interface.
- The quality of information they were looking for wasn’t what they expected.
Other reasons could be:
- Technical errors such as 404 page errors.
- Poor mobile/tablet optimisation.
Why a bounce rate may be different for a history blogger
A bounce rate can be quite an emotional part of your analytics and one that I don’t want you to overanalyse as a sign of someone liking your history blog or not. So, if you’re addressing the generic issues above and not seeing many changes don’t get too hung up on the bounce rate.
Unless you’re monetised or have products that you’re actively selling then a blog’s bounce rate is typically higher than that of the average website. It is not uncommon (and you’ve likely done this many times) for a user to spend time simply reading the information they need on a single page then leaving. Imagine you needed a fact about King Louis XIV. You’d look at that page, grab your fact and leave. You wouldn’t necessarily look at posts about Marie Antoinette or Philippe I, Duke of Orléans as that wasn’t what you needed for your French history post.
But, don’t neglect the opportunity to show them something else. It is an optimum opportunity to add a delayed pop-up inviting them to join your mailing list email or add links to other sections of the site to encourage them to read something else.
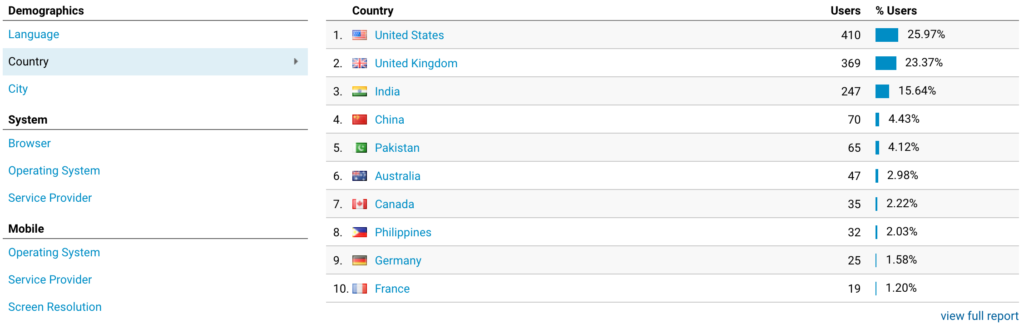
Why does demographics matter?
At face value, it’s pretty cool to see the country’s where someone clicked on your blog. But, this information comes in handy when you’re making decisions on your website design and content. If you’re noticing a substantial pattern with a lot of visits from, let’s say France again, then can you maximise your content and aim specifically at them? Can you find opportunities to be more inclusive by adding Google translate?
What else can Google measure?
Devices
The type of device that’s most popular on your list will inform how you build your website. If it’s more mobile users than desktop then you should really focus your efforts on adapting and testing the site so that it displays correctly on mobile. Most of us work from laptops but view content on our phones so you should also always check your blog posts on your mobile for weird spacing, wrapped text or chunky paragraphs.
Interests
What else are your users looking at on the internet? If they’re doing a lot of searching for resources like history books or laptops then you have scope to add in affiliate links to relevant products.
Age and Gender
You can tailor your history blog content to your audience. For example, If your views are from predominantly men or women in their 30’s will they have less time to view your content owing to work and family commitments so short bite-size material works better? Though this is obviously not true of everyone, it does give you a baseline to work from when deciding content length.
Again, if your users are 13-18 years olds you’re looking at a student audience. Build your content around their expectations and requirements such as video or downloadable packs for studying or try linking to other valuable websites and resources.
You can also use this information to inform where you put your efforts on social media and marketing. Ask yourself, Where does your demographic hang out? Tik Tok or Facebook? For example, significantly more women than men use Pinterest and younger people like Instagram and Tik Tok.
Are you sold on the importance of analytics?
I hope you can see that beyond the technical terms and scary graphs, analytics’ sole purpose is to answer questions you have about the direction of your blog or website and its content.
Whether you have a blog or a multi-format website, or you’re regularly selling products, Google Analytics can help you make key decisions about where, how and when you put your time, energy and money.
For further help on how to make decisions about your blog’s future, check out my free video mini-training “Stop Wasting Time and Get More Done on Your History Blog.” which shows you in three steps how to efficiently and positively plan the direction and content of your blog.
Click here to get started on Google Analytics today,